Comuvia
Comuvia / ForeGlass

AI buildout: financing and serving-cost review

Research preview • synthetic scenarios • not company forecasts

This local review keeps modeled provider paths, public-source boundaries, local-hosting assumptions, and customer-value arithmetic separate. Each provider path stops at its first unmet funding need; no bridge loan is invented. It does not report a composite fragility index, hardware benchmark, probability, or company forecast.

Synthetic provider paths

Switch the serving-cost hypothesis and read each path separately. The lines are conditional accounting paths, not measured company results.

A terminal liquidity value below zero is an unmet funding need, not cash available to spend. The chart does not draw later quarters until financing is separately modeled.

Table fallback for the selected chart

Source and evidence boundary

Facts still missing

    Local hosting: modeled cost, unmeasured acceptance

    Cost arithmetic is shown only with the retained result assumptions. Capacity is assumed, and quality remains unmeasured unless the run says otherwise.

    Customer-value sensitivity

    This is conditional economic capacity value, not automatically cash profit or a general adoption claim.

    Is AI creating durable business value?

    Actual source observations below use different populations and periods. Adoption, applications, projected employer formations and profits are separate measures. None is a causal AI profit estimate.

    MeasurementValuePeriodDenominator / scopeEvidence
    Firms using AI in a business function18 percentNovember 2025-January 2026BTOS firms, firm-weightedSource
    Business-function AI use, employment weighted32 percentNovember 2025-January 2026Employment-weighted BTOS firms, not percent of workers personally using AISource
    AI adopters using three or fewer business functions57 percentNovember 2025-January 2026Firms reporting AI use in at least one business function during the study reference periodSource
    AI users relying solely on augmentation66 percentNovember 2025-January 2026AI-using firms reporting some task effectsSource
    Firms reporting AI-related employment decreases2 percentNovember 2025-January 2026AI-using firms (firm-weighted), Table 4; not all businessesSource
    US business applications, seasonally adjusted531728 applicationsAugust 2026; released September 11Eligible EIN applications; not operating firms or profitable startupsSource
    Projected employer formations from August application cohort28501 projected firmsWithin four quarters of August 2026 applicationAugust application cohort; not firms born during AugustSource
    EU enterprises using AI13.5 percent2024Enterprises with 10+ people in covered sectors; differs from US BTOSSource
    EU enterprises using AI20.0 percent2025Enterprises with 10+ people in covered sectors; differs from US BTOSSource

    US BTOS changed its AI question in November 2025. EU coverage differs from US coverage. Do not join these into one growth curve. For company profit, compare matched firms or randomized workflows with prior trends, costs and selection accounted for.

    Deployment maturity: a testable ladder

    1. Exploration: A bounded budget and task hypothesis
    2. Assisted task: Accepted quality, net time and rework after review
    3. Integrated workflow: Unit cost, throughput, latency and reliability after integration
    4. Scaled capability: Incremental contribution margin or retained revenue against a credible counterfactual

    Task capability, organizational readiness and profitability are distinct. Higher maturity is not a promise of higher profit.

    Download observations and measurement plan

    Hardware cost and provider prices

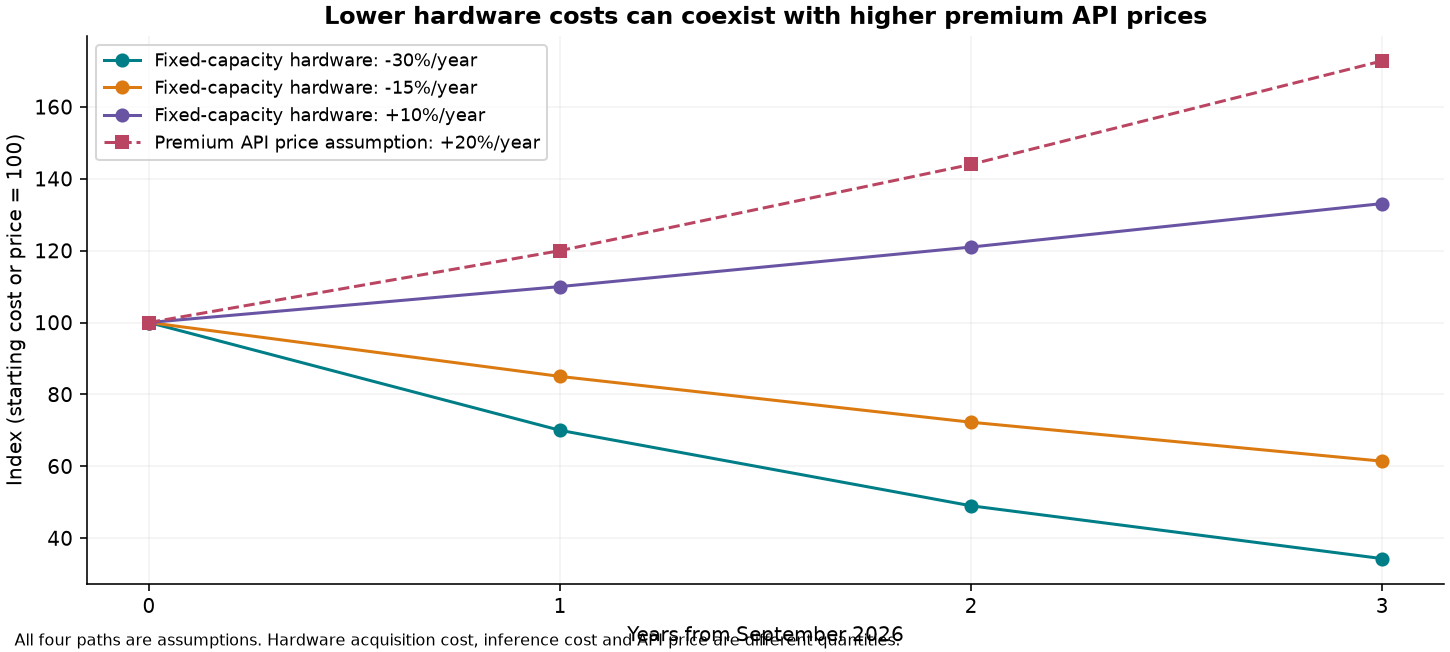
    Fixed-capacity acquisition costs and premium API prices can move in different directions. Every curve below is a sensitivity assumption, not an observed forecast or resale valuation.

    Three synthetic hardware acquisition-cost indices and one premium API price assumption